Get Lexile Student Data Plot
Overview
This API will take in student measurement information and generate a graph of their projected growth. No PII is required and no data is saved.
Authentication: Before using this API, you must obtain an Authentication Token
from the authToken endpoint. Use that endpoint to pass your
client credentials and receive an accessToken. Then hit
the Authorize button and paste the token into that field. This will
allow you to make requests to the protected endpoints.
Authentication
POST/authToken Retrieve an Auth Token for use with protected endpoints.
Returns an accessToken to be passed in the
Authorization header for other endpoints. By default, the token
lasts 24 hours, and the response will include the number of seconds the token
expiresIn. This token is cached on the API, so subsequent calls
are very fast and will return the same token until expiration is near.
It is an advisable best practice to either call the authToken
endpoint before every call, or to cache the token on your end, and be prepared to
respond to a 401 once the token has expired by retrieving a new token and resending
the request.
application/json
{
  "clientId": "abcdefg",
  "clientSecret": "hijklmnopqrstuvwxyz"
}
Responses
| Code | Description |
|---|---|
200 |
Success Media Type: application/json Example Value / Schema |
400 |
Bad Request Media Type: application/json Example Value ⃒/Schema |
401 |
Unauthorized Media Type: application/json Example Value / Schema |
Chart Generation
POST/growth-chart Generate a growth chart based on student assessment data
Given historical student performance (measurements, dates), this API will generate a graph of their projected growth. No PII is required by the API, and no data is saved. Graphs can be generated for either the Lexile or Quantile frameworks, and in either English or Spanish.
The graph plots the student's measures and makes a prediction for growth through 12th grade. Visual indicators on the graph show the recommended growth path, as well as various Readiness Ranges. The graph should be WCAG 2.1 AA compliant, and all information required for the generation of informative alt-text is in the response data. Clients should use this data to write their own alt-text.
Parameters
Sample request body for the Lexile scale.
{
  "scale": "lexile",
  "language": "english",
  "measures": [
    {
      "testDate": {
        "month": 3,
        "year": 2021
      },
      "schoolYearStart": {
        "month": 8,
        "year": 2020
      },
      "grade": 4,
      "measure": 815
    },
    {
      "testDate": {
        "month": 3,
        "year": 2022
      },
      "schoolYearStart": {
        "month": 8,
        "year": 2021
      },
      "grade": 5,
      "measure": 930
    },
    {
      "testDate": {
        "month": 3,
        "year": 2023
      },
      "schoolYearStart": {
        "month": 8,
        "year": 2022
      },
      "grade": 6,
      "measure": 1040
    },
    {
      "testDate": {
        "month": 3,
        "year": 2024
      },
      "schoolYearStart": {
        "month": 8,
        "year": 2023
      },
      "grade": 7,
      "measure": 1170
    }
  ],
  "additionalOptions": [
    "recommendedGrowthPath",
    "universityReadinessRange",
    "communityCollegeReadinessRange",
    "workplaceReadinessRange"
  ]
}
Sample request body for the Quantile scale.
{
  "scale": "quantile",
  "language": "english",
  "measures": [
    {
      "testDate": {
        "month": 3,
        "year": 2021
      },
      "schoolYearStart": {
        "month": 8,
        "year": 2020
      },
      "grade": 4,
      "measure": 815
    },
    {
      "testDate": {
        "month": 3,
        "year": 2022
      },
      "schoolYearStart": {
        "month": 8,
        "year": 2021
      },
      "grade": 5,
      "measure": 930
    },
    {
      "testDate": {
        "month": 3,
        "year": 2023
      },
      "schoolYearStart": {
        "month": 8,
        "year": 2022
      },
      "grade": 6,
      "measure": 1040
    },
    {
      "testDate": {
        "month": 3,
        "year": 2024
      },
      "schoolYearStart": {
        "month": 8,
        "year": 2023
      },
      "grade": 7,
      "measure": 1170
    }
  ],
  "additionalOptions": [
    "recommendedGrowthPath",
    "advancedCollegeAndCareerReadinessRange",
    "fundamentalCollegeAndCareerReadinessRange",
    "limitedCollegeAndCareerReadinessRange"
  ]
}
Responses
Code	Description	Links
200
Success
Responses
| Code | Description |
|---|---|
200 |
Success Media Type: application/json Example Value / Schema Sample response body for the Lexile Scale Sample response body for the Quantile Scale |
400 |
Bad Request Media Type: application/json Example Value / Schema |
401 |
Unauthorized Media Type: application/json Examples: Missing Authentication Token Example Value / Schema Unauthorized Media Type: application/json Examples: Bad Authentication Token Example Value / Schema |
Examples
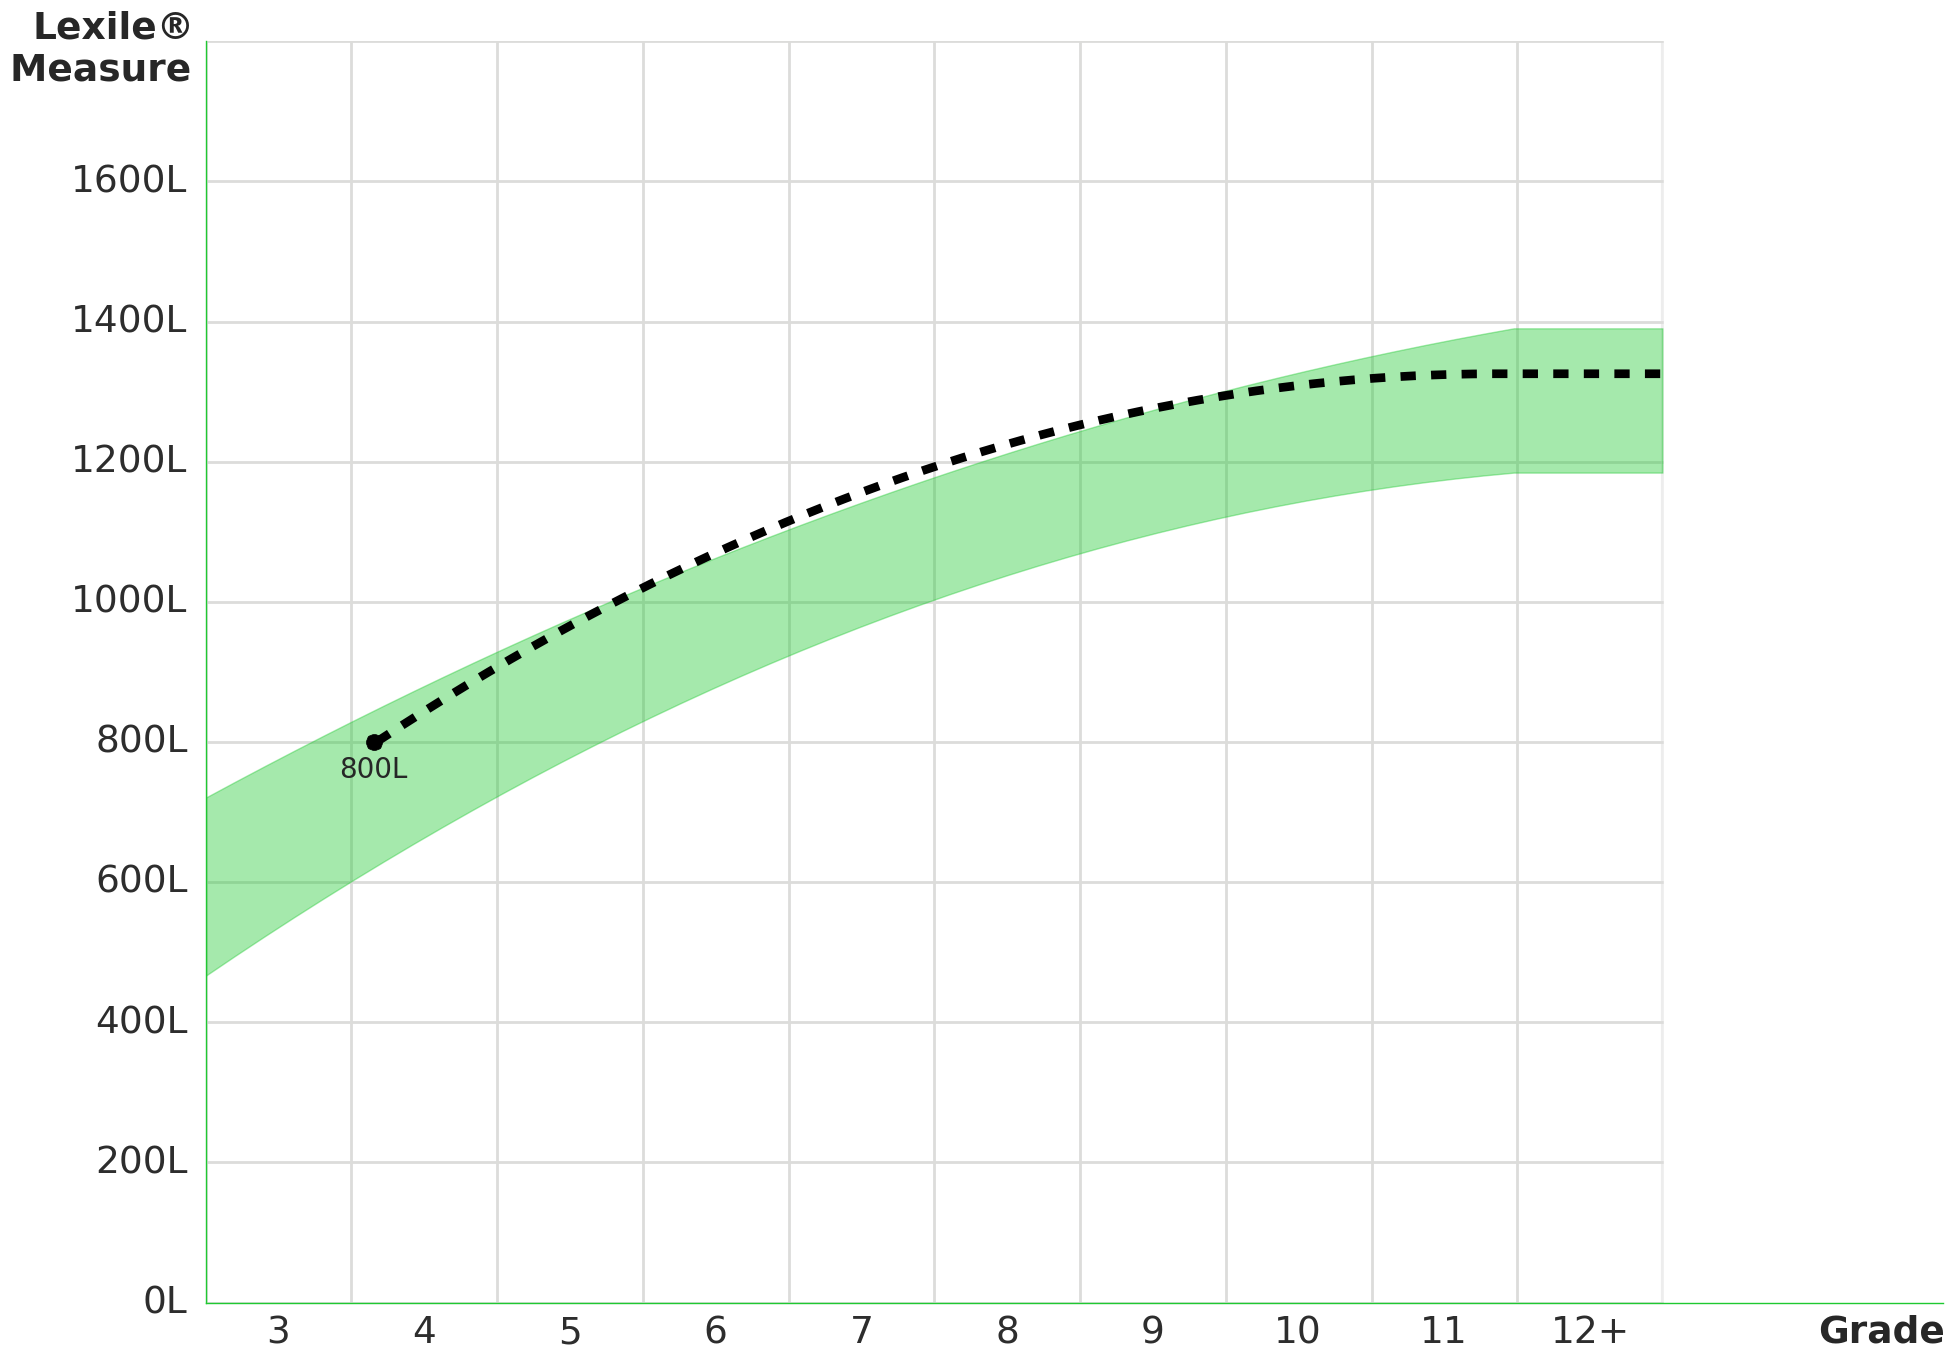
import base64
import json
import requests

body = {
    "scale": "lexile",
    "measures": [
        {
            "grade": 4,
            "measure": 800,
            "schoolYearStart": {
                "month": 8,
                "year": 2020,
            },
            "testDate": {
                "month": 9,
                "year": 2020,
            },
        },
    ],
}

response = requests.post(
    "https://atlas-growth-planner.lexile.com/growth-chart",
    json=body,
    headers={
        "accept": "application/json; version=1.0",
        "content-type":"application/json; version=1.0",
    },
)

output = json.loads(response.text)

file = open("single_lexile_measure.png", "wb")
file.write(base64.b64decode(output.get("chart")))
file.close()
import base64
import json
import requests

body = {
    "scale": "lexile",
    "measures": [
        {
            "grade": 5,
            "measure": 700,
            "schoolYearStart": {
                "month": 8,
                "year": 2011,
            },
            "testDate": {
                "month": 10,
                "year": 2011,
            },
        },
        {
            "grade": 6,
            "measure": 800,
            "schoolYearStart": {
                "month": 8,
                "year": 2012,
            },
            "testDate": {
                "month": 10,
                "year": 2012,
            },
        },
        {
            "grade": 7,
            "measure": 900,
            "schoolYearStart": {
                "month": 8,
                "year": 2013,
            },
            "testDate": {
                "month": 10,
                "year": 2013,
            },
        },
        {
            "grade": 8,
            "measure": 980,
            "schoolYearStart": {
                "month": 8,
                "year": 2014,
            },
            "testDate": {
                "month": 10,
                "year": 2014,
            },
        },
    ],
}

response = requests.post(
    "https://atlas-growth-planner.lexile.com/growth-chart",
    json=body,
    headers={
        "accept": "application/json; version=1.0",
        "content-type":"application/json; version=1.0",
    },
)

output = json.loads(response.text)

file = open("multiple_lexile_measures.png", "wb")
file.write(base64.b64decode(output.get("chart")))
file.close()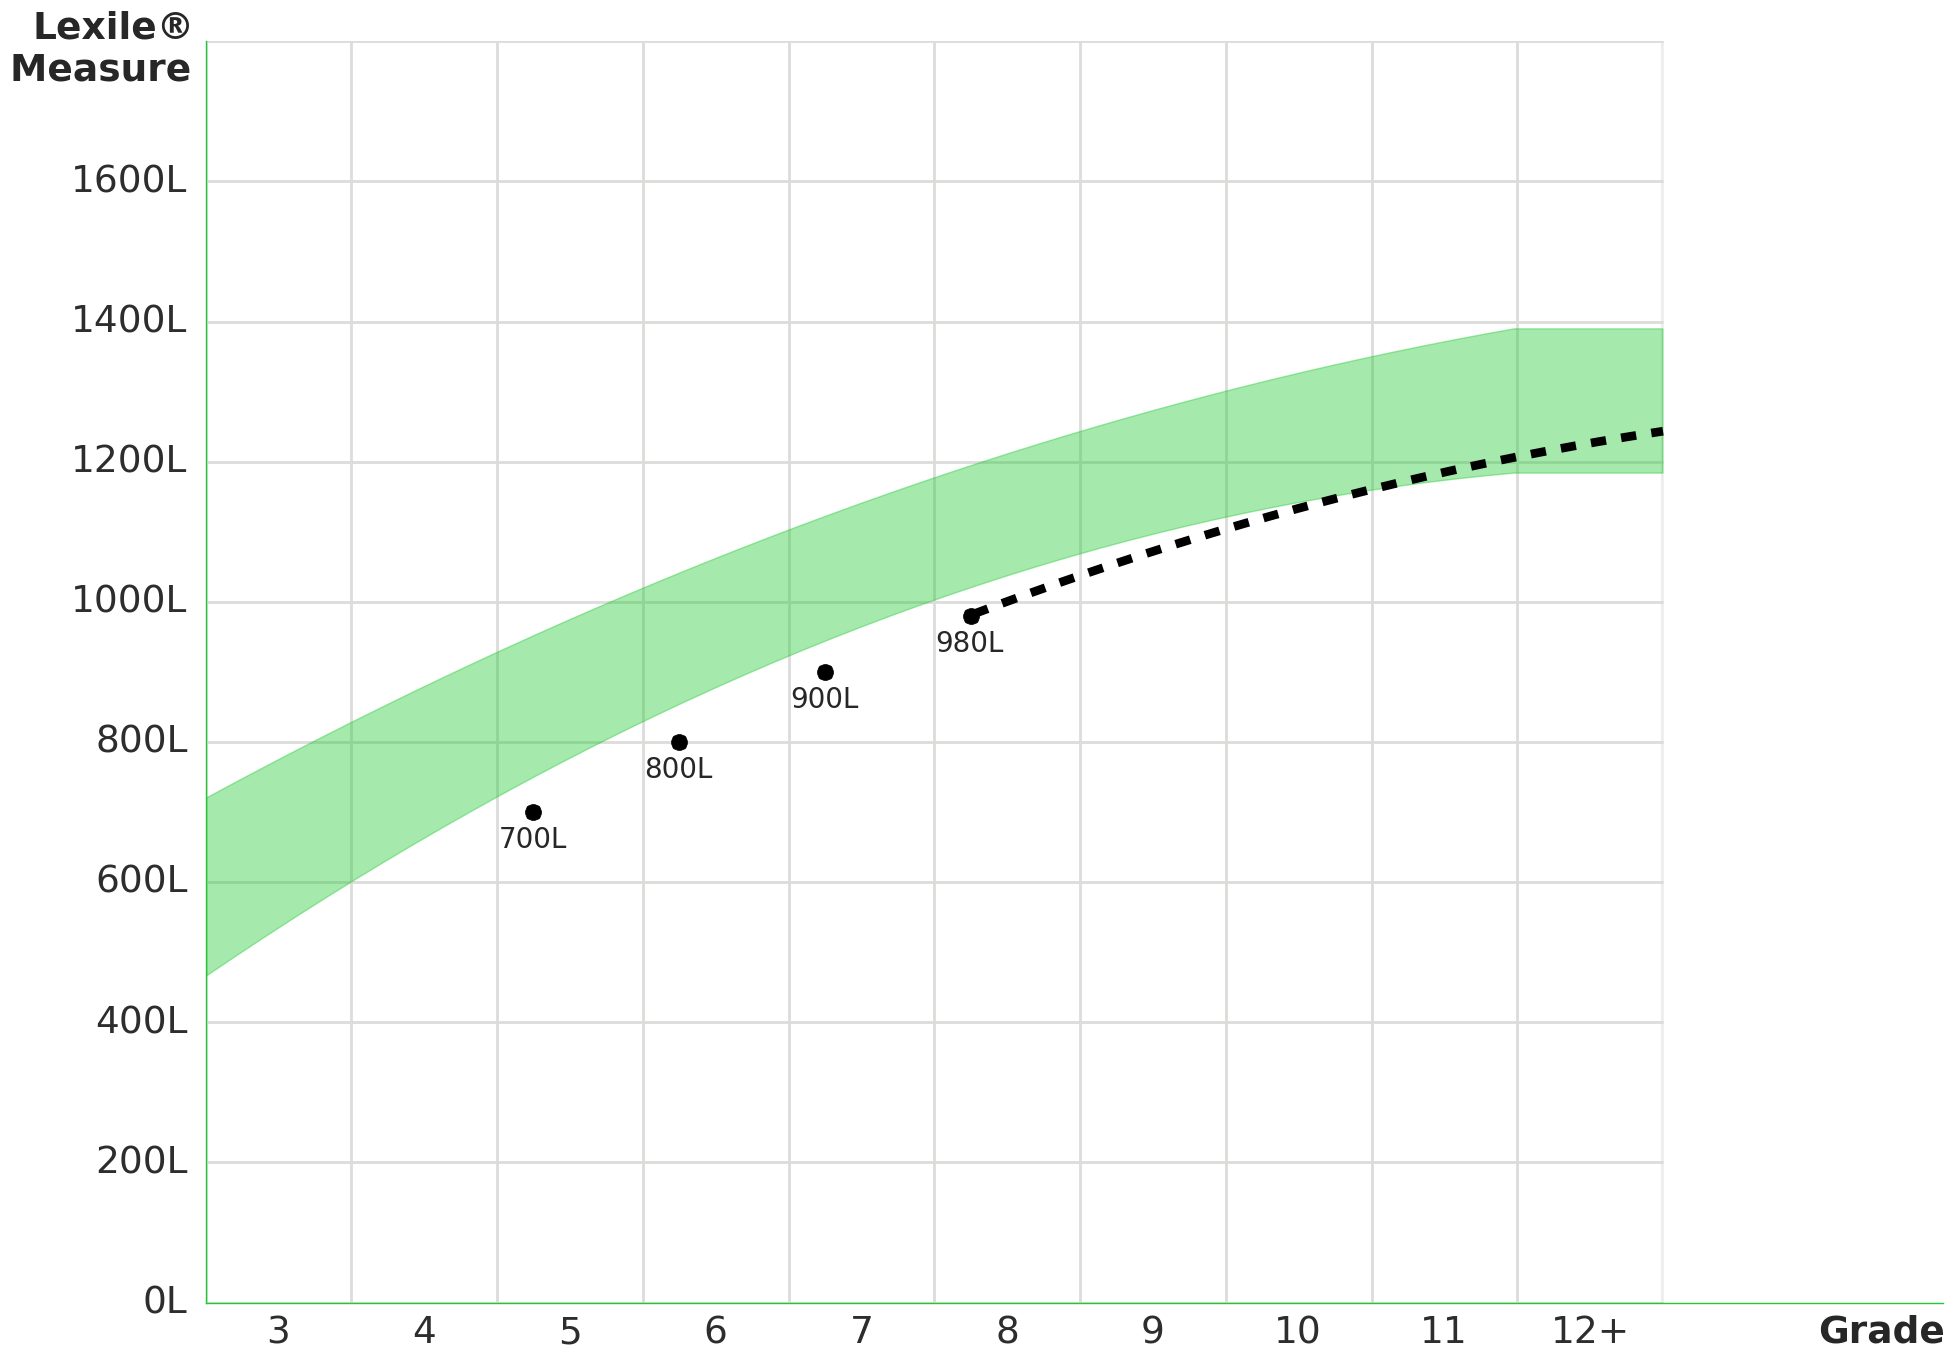
Schemas
|
lexileMeasureCollapse ➔ all integer [-400, 2000] Numeric Measure field for the Lexile framework. Example 1000 |
|
quantileMeasure ➔ Expand all integer [-400, 1650] Numeric Measure field for the Quantile framework. Example 1000 |
measureField ➔ Expand all (any | any) Integer
representation of measurement. Valid range is determined by
|
|
dateField ➔ Expand all object month integer [1, 12] year integer ≥ 0 |
lexileAdditionalOptions ➔ Expand all string Valid
Allowed values "recommendedGrowthPath" "universityReadinessRange" "communityCollegeReadinessRange" "workplaceReadinessRange" |
|
quantileAdditionalOptions ➔Expand all string Valid Allowed values "recommendedGrowthPath" "advancedCollegeAndCareerReadinessRange" "fundamentalCollegeAndCareerReadinessRange" "limitedCollegeAndCareerReadinessRange" |