Get Quantile Student Data Plot
Overview
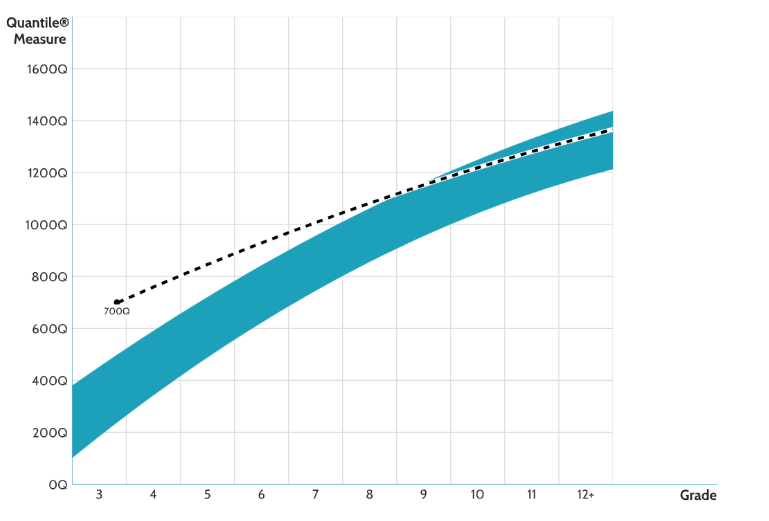
This will generate a base64 encoded image that shows the projected growth curve for the given Quantile measurement(s).
Parameters
| Parameter | Type | Description |
|---|---|---|
user_scores |
Object |
An object that contains the data required to plot a single user
measurement. This object must contain:
|
Response
The Quantile graph will be returned with 2 of the codes in this table. The first number (1, 2 or 6) will represent how many scores were given and how the graph was plotted and the 2nd number (3, 4, and 5) will represent the target information.
| Code | Description |
|---|---|
200 |
Success Media Type: application/json Example Value / Schema Sample response body for the Lexile Scale Sample response body for the Quantile Scale |
400 |
Bad Request Media Type: application/json Example Value / Schema |
401 |
Unauthorized Media Type: application/json Examples: Missing Authentication Token Example Value / Schema Unauthorized Media Type: application/json Examples: Bad Authentication Token Example Value / Schema |
Example
This example shows how to plot a single Quantile measure.
import base64
import json
import requests

body = {
    "scale": "quantile",
    "measures": [
        {
            "grade": 7,
            "measure": 1000,
            "schoolYearStart": {
                "month": 8,
                "year": 2017,
            },
            "testDate": {
                "month": 5,
                "year": 2018,
            },
        },
    ],
    "additionalOptions": [
        "fundamentalCollegeAndCareerReadinessRange",
    ]
}

response = requests.post(
    "https://atlas-growth-planner.lexile.com/growth-chart",
    json=body,
    headers={
        "accept": "application/json; version=1.0",
        "content-type":"application/json; version=1.0",
    },
)

output = json.loads(response.text)

file = open("single_quantile_measure.png", "wb")
file.write(base64.b64decode(output.get("chart")))
file.close()
This Python example shows how to plot multiple Quantile measures and save it as an image.
import base64
import json
import requests

body = {
    "scale": "quantile",
    "measures": [
        {
            "grade": 5,
            "measure": 700,
            "schoolYearStart": {
                "month": 8,
                "year": 2011,
            },
            "testDate": {
                "month": 10,
                "year": 2011,
            },
        },
        {
            "grade": 6,
            "measure": 800,
            "schoolYearStart": {
                "month": 8,
                "year": 2012,
            },
            "testDate": {
                "month": 10,
                "year": 2012,
            },
        },
        {
            "grade": 7,
            "measure": 900,
            "schoolYearStart": {
                "month": 8,
                "year": 2013,
            },
            "testDate": {
                "month": 10,
                "year": 2013,
            },
        },
        {
            "grade": 8,
            "measure": 980,
            "schoolYearStart": {
                "month": 8,
                "year": 2014,
            },
            "testDate": {
                "month": 10,
                "year": 2014,
            },
        },
    ],
}

response = requests.post(
    "https://atlas-growth-planner.lexile.com/growth-chart",
    json=body,
    headers={
        "accept": "application/json; version=1.0",
        "content-type":"application/json; version=1.0",
    },
)

output = json.loads(response.text)

file = open("multiple_quantile_measures.png", "wb")
file.write(base64.b64decode(output.get("chart")))
file.close()
